
Royfactory
설치·회원가입 없이 브라우저에서 바로 쓰는 무료 도구 · 계산기 · 미니게임
🔥 지금 인기
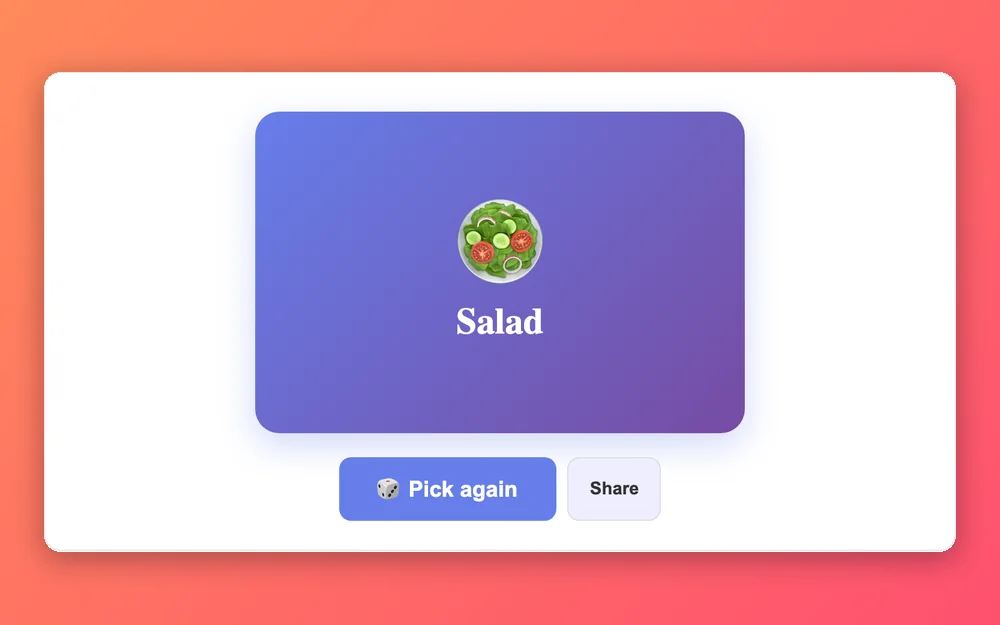
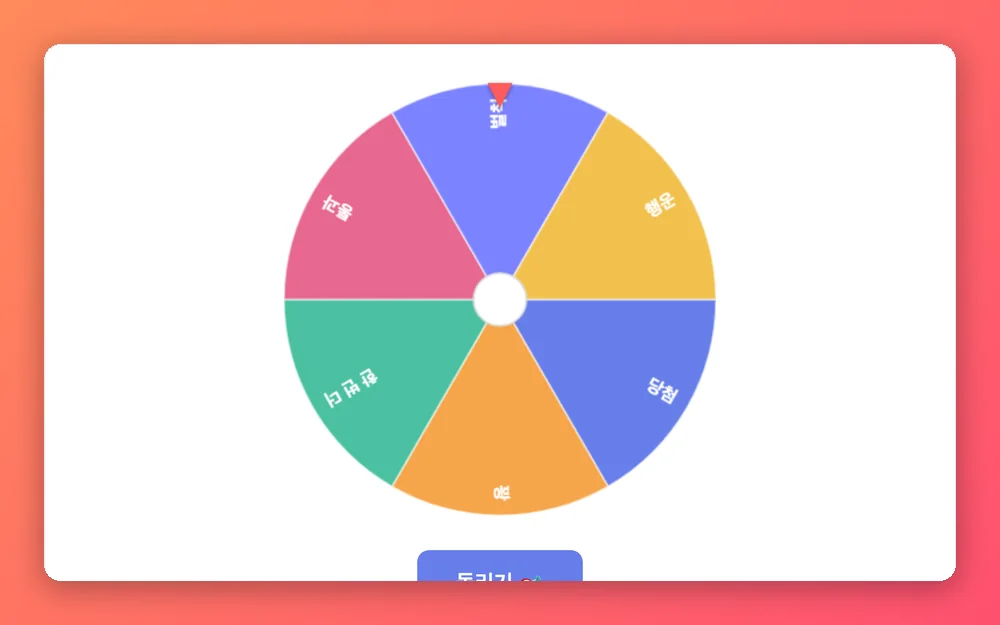
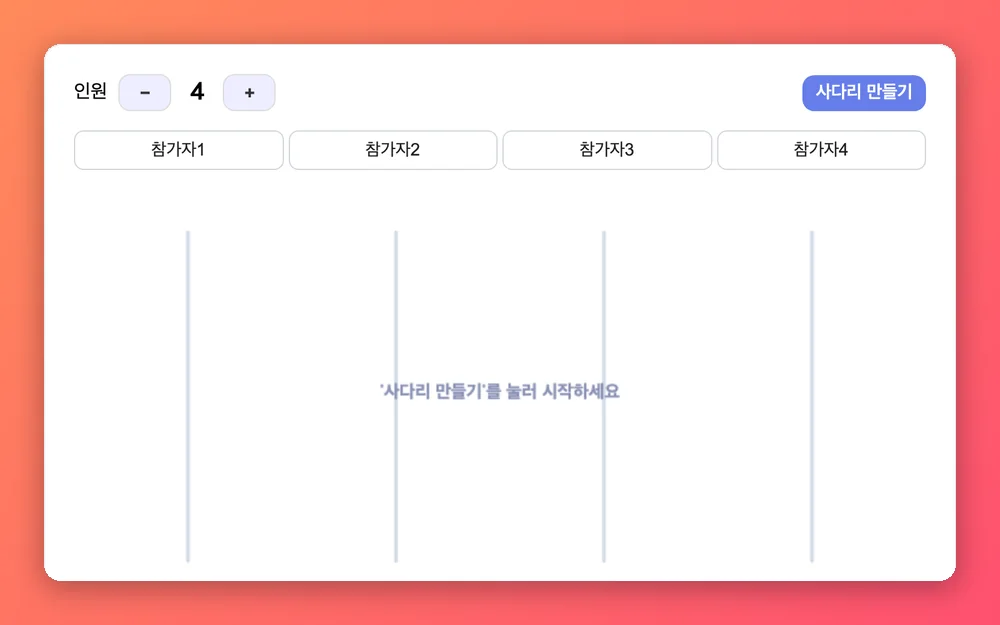
Trending뽑기 · 결정
Pick & Decide
계산기
Calculators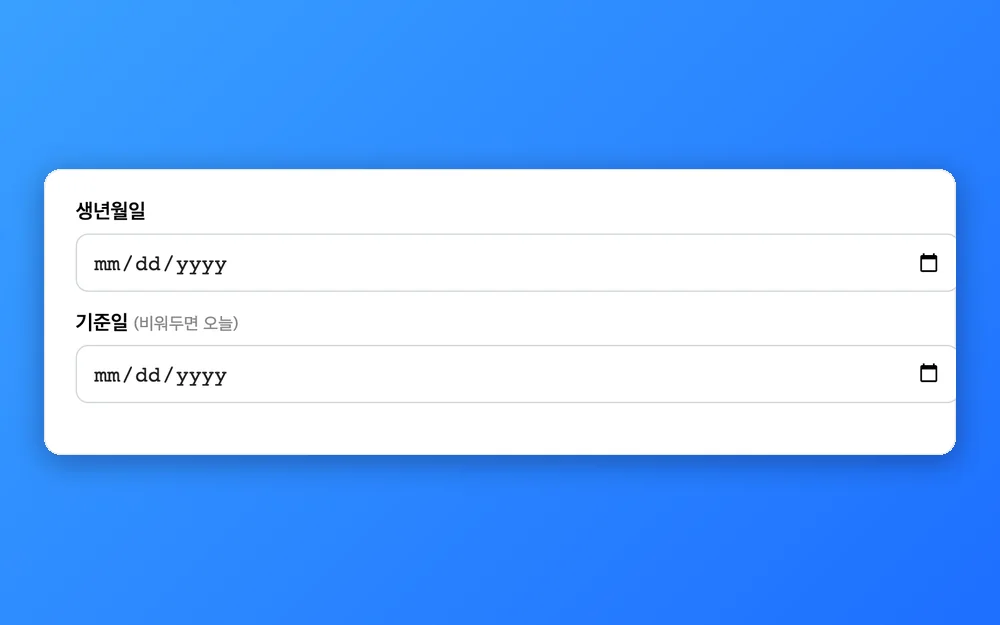
게임
Games


유틸리티
Utilities
개발자 도구
Developer Tools
모바일 앱
Google Play‘’ 에 맞는 도구가 없어요.
설치·회원가입 없이 브라우저에서 바로 쓰는 무료 도구 · 계산기 · 미니게임
‘’ 에 맞는 도구가 없어요.